


This app will compute a CurviLinear Regression for a series of x, y coordinates. The general equation form for a curvilinear regression is:
y = b(0) + b(1)x + b(2)x^2 + b(3)x^3 + b(4)x^4 + b(5)x^5 + b(6)x^6
where
b(0) to b(6) are term coefficients. In practice you will seldom go beyond 3 independent x variables.
CurviLinear Regression is organized into Projects of which an infinite number of projects can be stored. This app follows the same design pattern of the other regression apps (Linear Regression, Multiple Linear Regression and Multiple CurviLinear Regression). Transformations can be specified during data entry and data entry can be done by hand or comma-delimited batch data entry.
y is the dependent variable
x is the independent variable and
b( ) are the calculated coefficients
Note that there is just one independent variable (x). The degree of polynomial can vary from 2 to 6, and is user selectable. Taking x to a power provides the curvature in the regression line. You will seldom have to go beyond a fourth power, and may lose accuracy at a higher power.
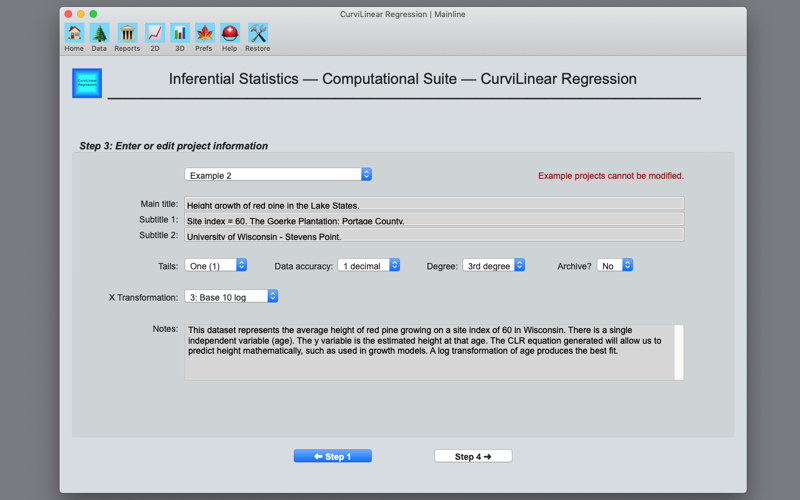
This app allows for an infinite number of data points for each regression. Example datasets are included to help users get started quickly. These examples serve as guides for organizing and entering data. You can turn these examples off under Preferences. A main menu provides the organizational structure for this app. From this menu you can choose to start a new project, work on an existing project (such as data entry), or produce tables and figures for output. This organizational structure follows throughout all of the regression and ANOVA apps in the Computational Suite. New projects are created by assigning a unique ID to the project. After entering the ID you can enter details associated with the project along with x, y data pairs. Data can be entered manually or from a comma delimited text file.
Reports include the regression variables, data frequency and residuals. If you have made any data entry errors, simply go back and correct them, then click on the reports menu item again.
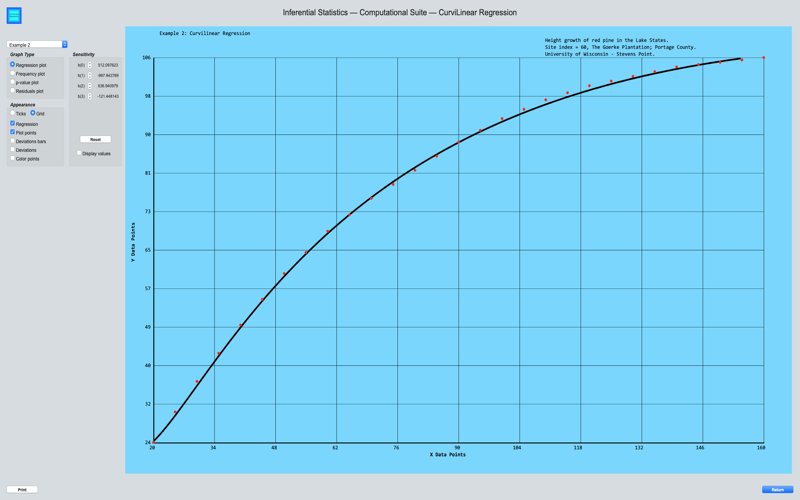
Two D graphics are available. You can test the sensitivity of the beta coefficients with the up/down arrows.
This app is also equipped with an automatic backup system. Each time you quit the app a backup copy is generated. Up to 1000 backup copies are kept. To restore a project from a prior backup, select the last menu item and follow the instructions.